
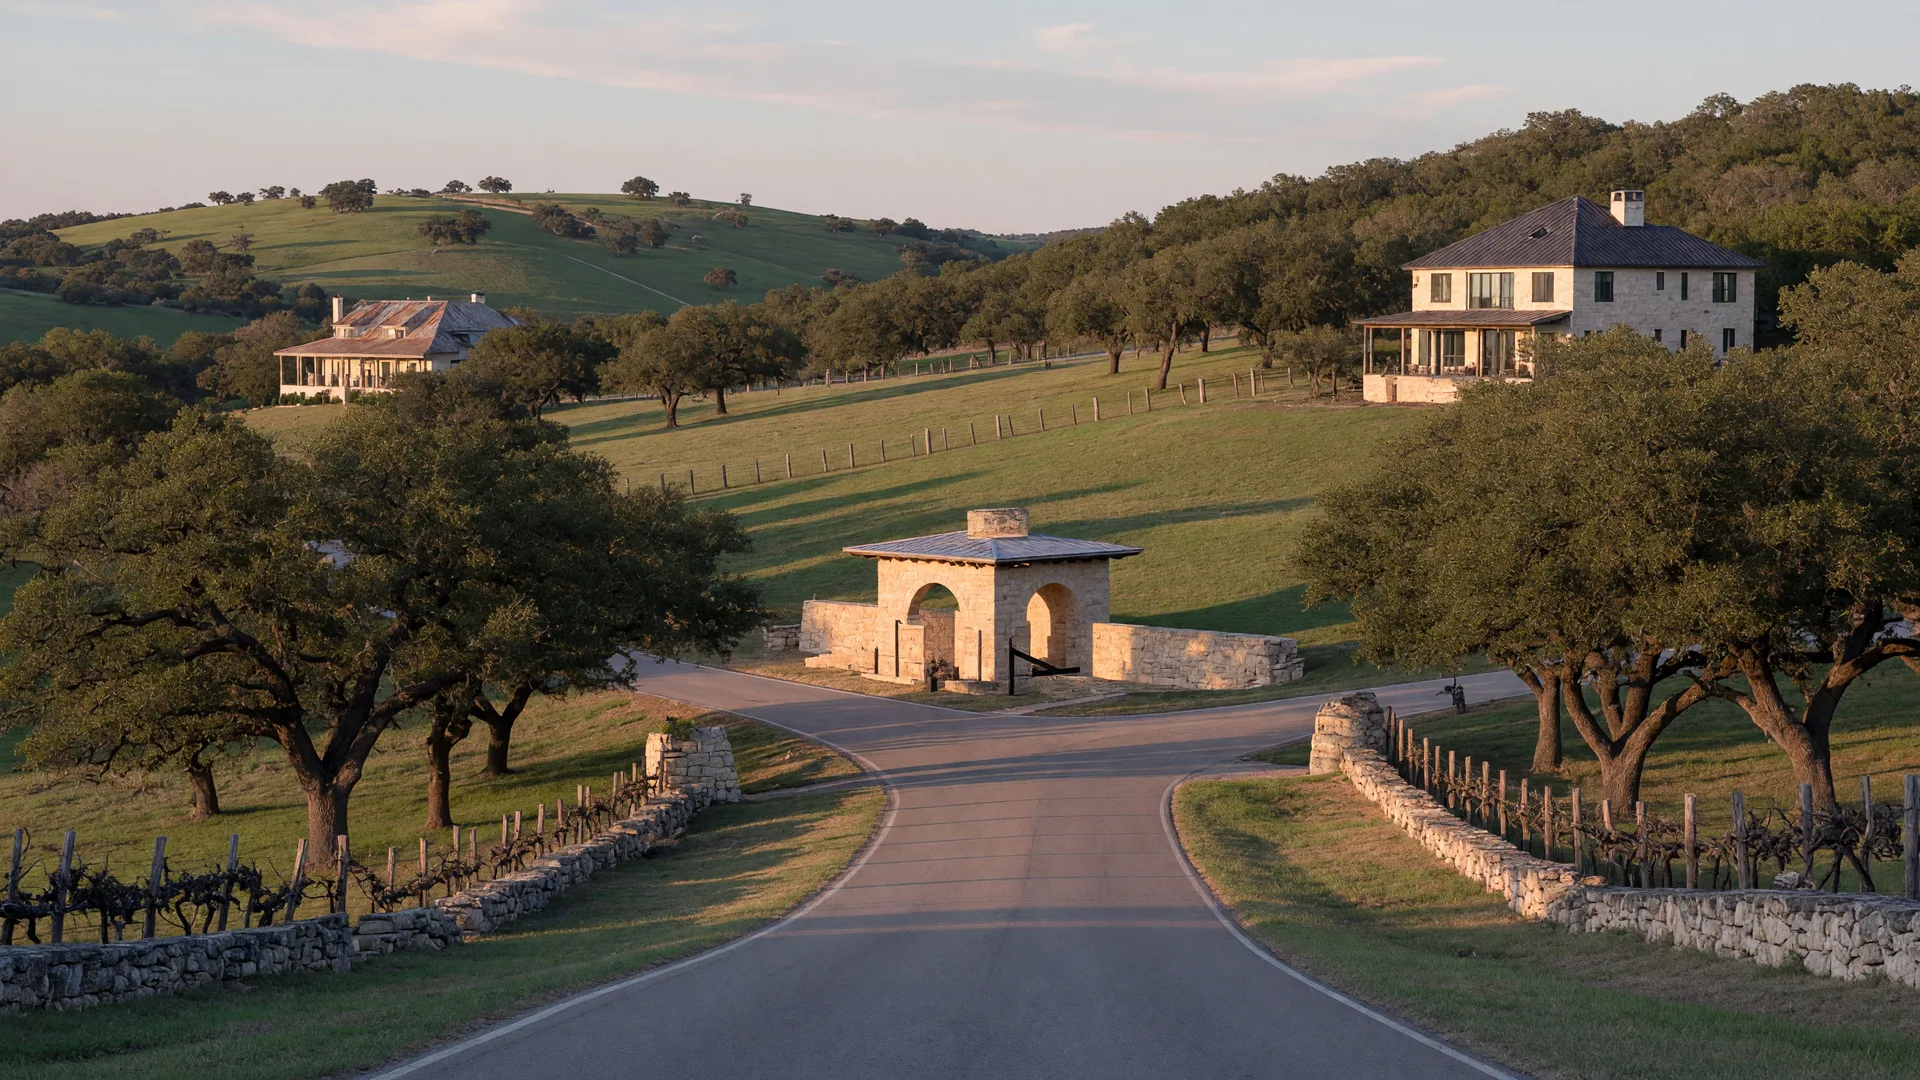
If you have been watching the Texas Hill Country market, you have probably seen one headline number and then a conflicting one a week later. The reality is that the Hill Country does not have a single market. It is a collection of sub-markets that move on different timetables: Boerne's older established neighborhoods, the production subdivisions along I-10, the gated golf communities around Fair Oaks Ranch, and the acreage corridor each follow their own supply-and-demand math. This report sorts the latest market data by neighborhood and price band, so you can see which segments are appreciating fastest, where inventory is genuinely tight, and how buyer competition differs from one segment to the next [1][4][7].
I track these segments separately for clients because the strategy changes by segment. A buyer targeting a home under $450,000 and a buyer targeting a $1.2 million estate are not shopping the same market, even though both show up in "Boerne sales." Your offer approach, your timing, and your honest expectations all depend on which micro-market you sit in.
Why the single "Boerne median" can mislead you
The San Antonio Board of Realtors and the major data portals publish a median price for Boerne, Fair Oaks Ranch, and Kendall County every month [1]. The numbers are real, and they still disagree with each other because they measure different boundaries and different months. As of mid-2026, published Boerne-area medians range from roughly $498,000 to more than $668,000 depending on whether you look at the city geography, the 78006 ZIP code, or a particular quarter [1][4][6]. Fair Oaks Ranch medians range from roughly $584,000 to $785,000 by source [2][5]. None of that is corruption; it is measurement. A ZIP-level median quietly blends a $300,000 townhouse, a $620,000 production home, and a $2 million golf estate into one line, and the mix shifts month to month.
What the headline median cannot show you is the reason you are actually reading this: how many listings exist in your segment, at what price, and how quickly they sell. That is the micro-market, and it is where every real decision gets made.
Hill Country micro-market snapshot, 2025 through mid-2026
| Market | Median price range | Inventory posture | Notes and sources |
|---|---|---|---|
| Boerne (78006) | ~$498K to ~$668K | Total supply up year over year, but the entry band stays tight | Median swings with new master-planned product; figures by source [1][4][6] |
| Fair Oaks Ranch (78015) | ~$584K to ~$785K | Low active count; golf and gated product dominate | Roughly 50 to 60 active homes in early 2026 [5][9] |
| Kendall County (countywide) | $627.9K median Q4 2025 | Median price per square foot ~$255 | SABOR county report, blending all communities [1] |
| San Antonio city (context) | ~$310K to ~$330K | Balanced overall ~3.2 months of supply; entry band tightest | Comparison point for the entry segments [8][11] |
Medians differ by source, county boundary, ZIP, and month. Use them as ranges and verify against the specific segment you are shopping. Data from San Antonio Board of Realtors (SABOR) reporting and the sources cited.
Where appreciation has actually been fastest
Look past the citywide median and the most consistent signal in the last two years is the price per square foot in the premium Hill Country band, roughly $600,000 to $1,000,000, which has been rising at about 3.8 to 4.5 percent year over year, the strongest momentum in the San Antonio region [1][7]. The driver is not speculation. It is basic scarcity: the supply of buildable Hill Country land with strong school zoning is limited, and new construction in master-planned communities carries much of the appreciation [3][7].
At the same time, the sub-$500,000 entry tier in Boerne behaves differently. There are relatively few new listings in that band, because most new product skews higher, and what does come on the market draws multiple offers and short decision windows [7][9]. Values there are not rising as fast as the upper band per square foot, but buyers experience it as the most competitive part of the market.
Segment-by-segment: appreciation, inventory, competition
| Price band | Appreciation signal | Inventory | Competition |
|---|---|---|---|
| Entry, under ~$500K | Stable, slower growth | Tightest in Boerne | Multiple offers, fast decisions [7][9] |
| Core, ~$500K to $800K | Moderate, steady | Most balanced | Well-priced homes still draw multiple [2][4] |
| Premium, ~$800K to $1.5M | Fastest per square foot, +3.8 to 4.5% | Plentiful but selective | Selective; best positioned draw 20+ showings [1][7][9] |
| Estate and acreage, $1.5M+ | Scarce land carries the value | Limited good acreage | Multiple offers on the best tracts [10] |
Segments are approximate and shift with the quarterly SABOR data. The sources below carry the underlying figures assigned to each band.
Neighborhood by neighborhood: the micro-map
Once your price band is set, the neighborhood is what decides the actual experience on the ground. The same budget buys different product within ten minutes of the same exit, and the price per square foot tells the story [12]:
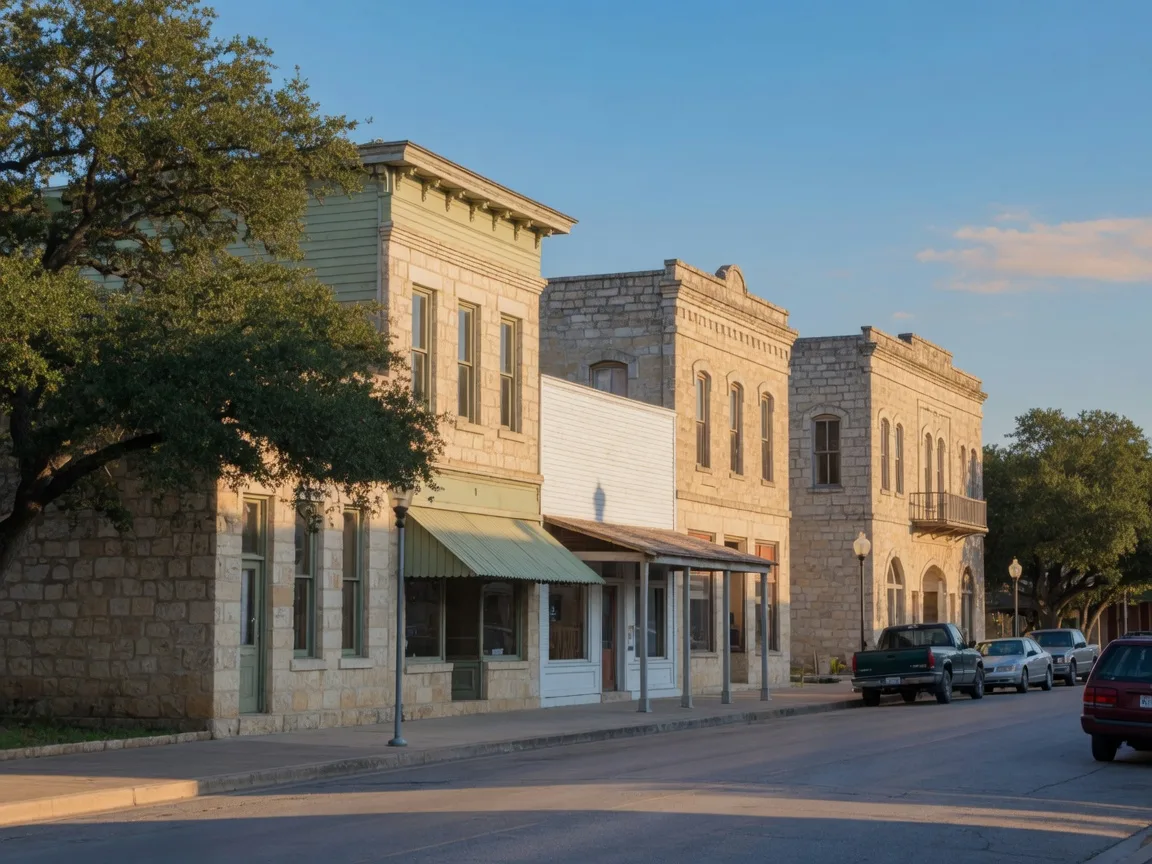
- •Historic downtown Boerne: the walkable core with limestone storefronts and older homes, the highest per-square-foot values, roughly $230 to $280, and ownership turns over slowly. An example of the Boerne downtown micro-market.
- •Production subdivisions like Esperanza, Corley Farms, and Regent Park: newer homes, roughly $190 to $220 per square foot, with steady buyer competition on well-priced new builds.
- •Fair Oaks Ranch: golf and gated product at ~$200 to $250 per square foot; properties on the golf course command a premium and a faster sale [5][9].
- •Cordillera Ranch and the luxury estates: $280 per square foot and up, with resort amenities; the most expensive and the most inventory-plentiful segment.
- •Acreage with Boerne ISD zoning: lower per-foot construction cost (~$180 to $220) but higher total price from the land, and it sells first in the luxury tier [10].
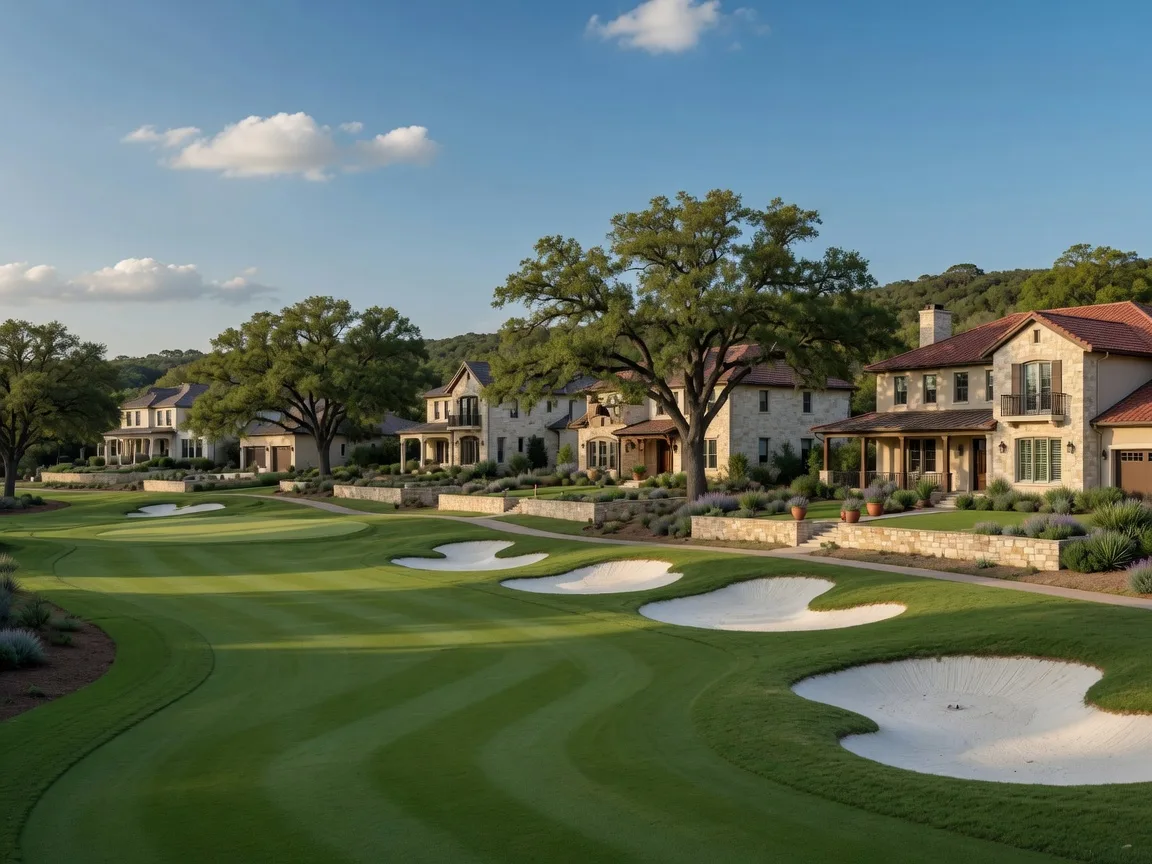
For a fuller neighborhood-by-neighborhood read, the community guides cover the character, lot sizes, and school lines of each one: Fair Oaks Ranch, Cordillera Ranch, Esperanza, and Spring Branch among others. The published price bands above are from local SABOR-based figures; the details live in each neighborhood page.
Where inventory is genuinely tight
The market report summary is one thing; the listing counts are another. With the current data in hand, the genuinely tight places are:
- •Boerne's entry tier below ~$500,000. New product skews above that, and few sellers list in it, so the few that do see the most competition of any Boerne band [7][9].
- •The San Antonio $300,000 to $400,000 entry. That band was the largest share of sales in the metro and carried the tightest inventory, fueled by first-time buyers and military demand near JBSA [11][8].
- •Quality acreage with good school zoning. The scarce, desirable tract that combines land, live oaks, and a Boerne or premium district draws the heaviest competition [1][10].
- •New construction in the hot subdivisions. Builders release phases in small batches, and the best lots sell before they are advertised [3].
On the flip side, the list of looser segments matters too: the Fair Oaks Ranch luxury market has been carrying a meaningful overhang of higher-market listings, roughly 70 or more active luxury properties, so a well-positioned luxury home still draws attention while average million-dollar homes sit and need price adjustment [9].
What competition looks like in each segment
Competition is the thing that shows up in the days-on-market and the list-price-to-sale ratio long before it shows up in the median. The local listing data has a useful memory here: in 2021 the competition was universal and short, with homes commonly selling 5 to 10 percent above list [12]. In 2025 and 2026 most Boerne homes sell at or within a few percent of the list price, and the contest concentrates in the entry tier and the best-positioned upper segment [4][2][12].
That changes what "being competitive" means by segment:
- •Under ~$500,000: be ready to view the same day, offer with a full pre-approval, keeping contingencies to what you actually need, and expect multiple offers on anything in good condition and properly priced [11].
- •Core $500K to $800K: the most balanced; good values and price precision matter more than speed, and the buyer who identifies the right home and negotiates carefully gets the win.
- •Premium $800K to $1.5M: selective competition. The right property in the right location still draws 20 or more showings and multiple offers within the first week, while most of the segment sits and needs price adjustment [9][10].
- •Estate and acreage: the win goes to the buyer who executes due diligence fast, well, septic, flood and survey ready, because the land does not wait [10].
What this means for a California buyer
Most of the relocation families I work with arrive with a budget band and two gating constraints: commute tolerance and school district. Those two constraints select your micro-market faster than any index does. If your commute ceiling is 30 minutes, the Boerne-adjacent corridor from Fair Oaks Ranch and the Edge of-I-10 into San Antonio works, and the school district the lot feeds matters more than the district name on the map. How to read the district reality rather than a zip code. We have a whole breakdown of it in School Districts Don't Match Zip Codes and the real drive times in The Commute Calculus.
The economic context matters too. The same California budget that is squeezed in the Bay Area commands a different band here, and the tax, insurance, and lifestyle totals are not intuitive. My full model on that side is California vs. Texas: The Real Cost Comparison Model, and the year-two property tax mechanics, the most common surprise of the move, is covered in Why Texas Tax Bills Jump After You Buy.
And when the market feels like a fight, remember the decision protocol is the same in every segment: know your budget down to the monthly carrying cost, know which school and commute you will accept, get the pre-approval and the well-septic-survey due diligence kit ready before you tour, and treat every home that matches both criteria like it will go under contract this week, because in the tight bands it will [1][10].
A note on the data
Market posts like this compress a lot of monthly numbers into a single line. The medians in this article differ by source: SABOR county reports, the portal medians, and the ZIP-level trends measure different things [1][4][6]. None of them will predict the exact number a seller will accept, but each one tells part of the story. I read all of them before I recommend an offer, and I recommend you do the same, using the sources below.
Frequently asked questions
Which Hill Country micro-market is appreciating fastest right now?
The premium band roughly $600,000 to $1,000,000 with a concentration of new product (gated communities, golf courses, and small master plans) has shown the strongest per-square-foot momentum at ~3.8 to 4.5 percent annualized, while the entry tier below $500,000 has the tightest inventory and the highest competition, even though valuations grow more slowly there [1][7].
Why do different sites report such different medians for Boerne and Fair Oaks Ranch?
The city geography, the ZIP (78006 vs 78015), the county, and the quarter each give a different set of homes, and new-construction product mix swings the median month to month. It is not an error; they are different measurement windows [1][4][6]. In practice I always quote a range, not a single number.
Is the under-$500,000 Boerne market really "sold out"?
Sold-out, no; thin, yes. Most new construction skews above $600,000, so the sub-$500,000 inventory comes to market slowly and meets several buyers at once. Watching the new listings and acting within the first two to three days is the difference between competition and a calm buy [7][9].
Do I need to offer above list price in 2026?
Not as a default, which is a change from 2021-2022 when over-list was common. In 2025 and 2026 most listings sell at or within a few percent of list. Above-list offers are the exception, and the offers that do win are built on appraisal care, closing flexibility, and financing strength, not just a bigger number [4][2].
Should I buy new construction in the hot subdivisions or buy resale in an established niche?
It depends on the trade threshold of time versus price. New construction gives you the upgraded finishes, but the build timeline, the lot premiums, and the finish-upgrade budget add waiting months and dollars. The existing homes in the $500 to $800 band sell closest to list and offer immediate occupancy, which often matters more to a relocation family with a hard move date.
Sources
- San Antonio Board of Realtors (SABOR), Q4 2025 Kendall County market report, via Summers Real Estate. Countywide median, average sale price, price per square foot, and market stats. summersre.com
- Community Impact (SABOR data), "Median home prices increase year over year in Boerne, Fair Oaks Ranch" (September 2025). Year-over-year median changes for both communities. communityimpact.com
- MySanAntonio, "These booming Texas Hill Country cities see rise in home prices." Region coverage of the two communities' price trends. mysanantonio.com
- Redfin, Boerne housing market. Median sale price, price per square foot, and days on market estimates. redfin.com
- Redfin, Fair Oaks Ranch housing market. Median sale price and listing count for 78015, plus metro comparison. redfin.com
- HAR.com, ZIP 78006 price trends. ZIP-level median price over time for the Boerne 78006 geography. har.com
- The Gahm Real Estate Team, Boerne TX market trends. Segment by segment color on appreciation and the inventory shifts. thegahmrealestateteam.com
- LRG Realty, San Antonio housing market forecast for 2026. Metro-level supply and demand and the shift toward balance. lrgrealty.com
- LRG Realty, Fair Oaks Ranch luxury market guide. Luxury listings and the supply overhang in the premium band. lrgrealty.com
- Weigand Real Estate, "Selling a Luxury Home in Fair Oaks Ranch (the Back 40)." Showing counts and multiple-offer behavior on premium acreage. weigandrealestate.com
- The Howell Group, San Antonio real estate market (June 2025). Segment shares and the competition in the under-$400K band. kimberlyhowell.com
- MoveToTexas, Boerne community profile. Community-level price per square foot and lifestyle framing for the Hill Country. movetotexas.net
Market medians and inventory counts vary by source, ZIP boundary, and month. This article is neighborhood guidance and general real estate education, not a price estimate for any specific property. Verify the current figures against the specific listing and your agent before you decide.
Last verified: September 9, 2026
Published: September 9, 2026
Updated September 9, 2026