
Enjoy this guide? Make HillCountryHomesteads.com a preferred source in your Google AI searches.
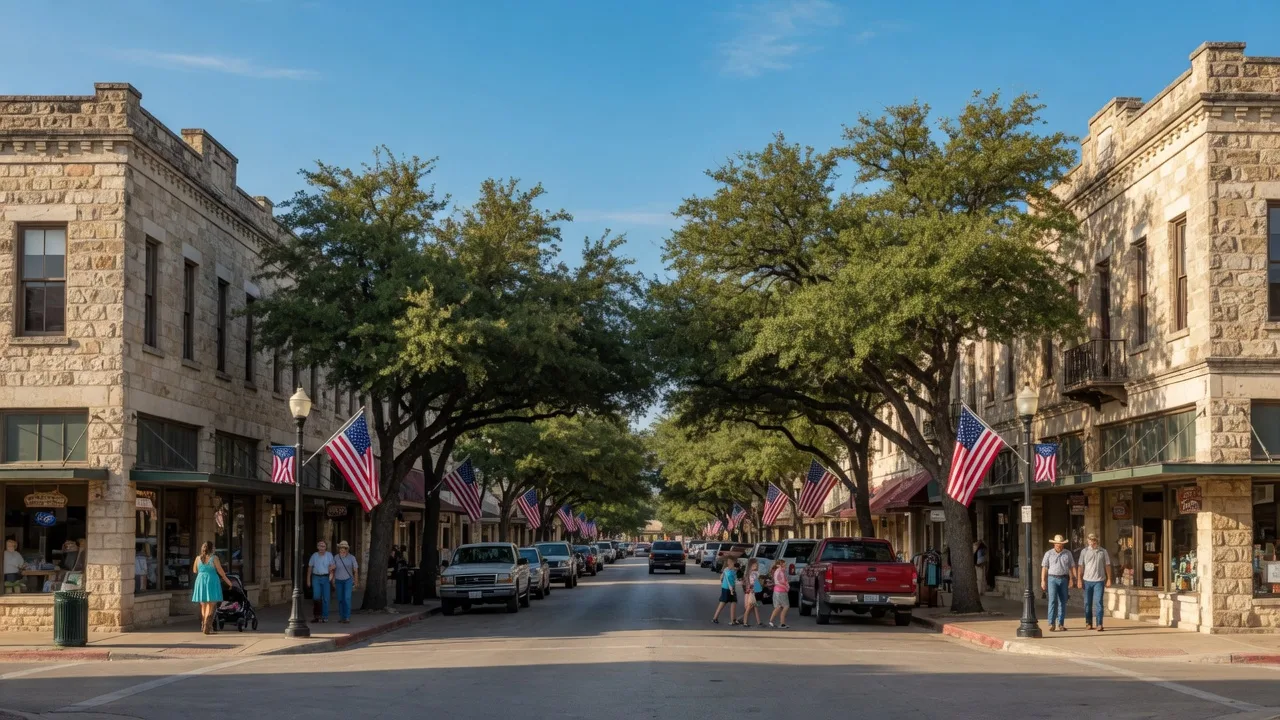
Boerne TX Housing Market
Home values, price trends, inventory data, and what buyers and sellers need to know about the current Boerne real estate market.
The Boerne TX housing market has experienced sustained growth over the past several years, driven by inbound relocation from higher-cost states, the appeal of A-rated Boerne ISD schools, and the broader Hill Country lifestyle draw. While the market has cooled from the peak intensity of 2021-2022, it remains active and competitive in most price ranges.
This update provides the current market data -- median prices, inventory levels, days on market, and price trends -- along with context on what these numbers mean for buyers and sellers in the Boerne area.
Boerne Market Snapshot
| Metric | Current Estimate | Trend |
|---|---|---|
| Median home price | ~$606,000 | Moderate increase year-over-year |
| Months supply of inventory | ~2.5-3.0 months | Gradually increasing from low inventory |
| Average days on market | ~45-60 days | Slightly longer than 2022-2023 |
| Median price per sq ft | ~$210-235 | Varies significantly by neighborhood |
| Sales volume (annual) | Consistent with historical averages | Stable |
Data from San Antonio Board of Realtors (SABOR) and local MLS. Figures are approximate and change monthly. For the most current data, contact me directly.
Median Home Prices and Price Trends
The median home price in Boerne has risen steadily over the past five years. From approximately $450,000 in 2020, the median climbed to roughly $606,000 by mid-2026. That represents cumulative appreciation of roughly 35 percent over five years -- substantial, but concentrated in the 2021-2022 period.
Since early 2023, price growth has moderated to 2-5 percent annually, reflecting the national shift toward a more balanced market. Price reductions have become more common on properties that are overpriced from the start, and the gap between list price and sale price has narrowed. In 2021, it was common for Boerne homes to sell 5-10 percent above list price. In 2025-2026, most homes sell at or within 2-3 percent of list price.
For year-over-year comparisons and specific monthly data, see the Boerne Housing Market Update section.
Price per Square Foot Context
Price per square foot in Boerne ranges widely based on location, lot size, age of home, and finishes. General ranges by area:
- Historic downtown Boerne: $230-$280/sq ft. Older homes on smaller lots, walkable location commands a premium
- Newer subdivisions (Esperanza, Corley Farms, Regent Park): $190-$220/sq ft. Production homes with standard finishes
- Fair Oaks Ranch: $200-$250/sq ft. Golf course properties command the higher end
- Cordillera Ranch: $280-$400+/sq ft. Custom luxury estate market with resort amenities
- Acreage properties: $180-$220/sq ft. Lower per-foot cost but higher total price due to land value
Inventory Levels and What They Mean
Months supply of inventory (MSI) is the key metric for understanding market balance. A market with 4-6 months of supply is considered balanced. Below 4 months favors sellers. Above 6 months favors buyers.
As of mid-2026, the Boerne market sits at roughly 2.5-3.0 months of supply -- still a seller-favorable market, but significantly more balanced than the sub-1.0 month supply seen in 2021. This means:
- For sellers: Well-priced homes in good condition still sell quickly. Overpriced homes sit. Pricing precision is more important than it was in 2021-2022 when almost anything would sell
- For buyers: More choices than previous years, but good properties in desirable neighborhoods still attract multiple offers. Being prepared with pre-approval and acting quickly on new listings is still important
Neighborhood-Specific Value Differences
The Boerne market is not one market. Different neighborhoods operate on their own supply and demand dynamics, and understanding these differences is essential for both buyers and sellers.
Cordillera Ranch
The premier luxury gated community in the area. Homes range from $800K to $3M+. The market here is driven by a national buyer pool, not just local demand. Inventory tends to be low, and days on market are longer due to the narrower buyer pool. Price reductions are common on properties that are aspirational rather than market-based in pricing.
Downtown Boerne
Historic homes within walking distance of Main Street carry a walkability premium. These properties attract buyers who want small-town character and access to dining and shopping without driving. Inventory in this segment is always limited. Homes here tend to hold value well even during market corrections due to the scarcity of walkable urban housing in the Hill Country.
Newer Subdivisions (Esperanza, Corley Farms, Regent Park)
These communities offer the most consistent inventory and the broadest buyer pool. Pricing is tightly correlated to school zone, proximity to I-10, and the specific builder. New construction competes directly with resale homes in these neighborhoods, which can pressure pricing if builders are offering incentives. See our new construction vs. resale guide for building options.
Acreage and Rural Properties
Acreage properties outside city limits have different valuation drivers: well depth and flow rate, septic system condition, ag exemption status, and proximity to Boerne amenities. These properties require the longest marketing timeline but appeal to buyers who specifically want Hill Country acreage. See our Boerne acreage guide for detailed information.
Market Forecast Considerations
The Boerne housing market forecast points to continued steady demand driven by relocation patterns and limited inventory. Understanding the broader Boerne housing market requires looking at the factors that drive demand here specifically:
- Relocation demand: Boerne's primary demand driver is inbound relocation from higher-cost states. As long as the cost-of-living differential between Texas and California, Colorado, and the Northeast remains large, relocation demand will support the market. California buyers should review our cost-of-living comparison.
- Interest rates: Higher mortgage rates have a moderating effect on price growth. The Boerne market has adjusted to the 6-7 percent rate environment with slower appreciation but not price declines
- New construction supply: New communities continue to add inventory, particularly in the $450K-$700K range. This new supply competes with resale homes and limits price growth in that segment
- Seasonal patterns: Spring and fall remain the strongest selling seasons. Winter inventory is lower, which can benefit sellers who are willing to list during the slower months
The consensus among local agents and market analysts is that the Boerne market will continue to see modest appreciation (2-4 percent annually) in the near term, barring a major economic downturn. The fundamentals -- school quality, lifestyle, relative affordability versus coastal markets -- remain intact.
How to Interpret Market Data When Home Shopping
Understanding market data is the difference between making an informed offer and overpaying -- or missing a property entirely. Here are the numbers that matter most when evaluating a specific home in Boerne:
- Days on market (DOM): A property that has been listed for 60+ days in a market where the average is 45 days is likely overpriced. Ask what price reductions have occurred
- List-to-sale ratio: In the current Boerne market, most homes sell between 97-100% of list price. Anything below 95% suggests the property was either overpriced or had condition issues
- Comparable sales (comps): Look at homes that actually sold, not homes that are still for sale. Sold data is the truth. Active listings are aspirations
- Price per square foot: Useful as a general indicator but should not be the sole determinant. A 2,500 sq ft home on an acre lot is not directly comparable to a 2,500 sq ft home on a 0.25-acre lot
- Months of inventory by price band: The market for homes under $500K is tighter than the market for homes over $1M. Know the specific inventory level for the price range you are shopping in
I prepare a comprehensive market data package for every buyer I work with, covering recent comparable sales, neighborhood trends, price per square foot ranges, and specific advice on offer strategy for the property they are considering.
Market Resources
Selling a Home in Boerne TX
Costs, timeline, disclosure requirements and preparation tips for sellers.
Read GuideBoerne vs. Fair Oaks Ranch
Community comparison for home values and lifestyle.
Read GuideCost of Living in Boerne TX
Housing, taxes, utilities, and daily expenses explained.
Read GuideBoerne Community Guide
Schools, neighborhoods, and lifestyle in Boerne.
Read GuideGet current numbers for your situation
Whether you are buying or selling, I provide current market data specific to the neighborhoods and price ranges that matter to you. No fluff. Just the numbers that drive good decisions.
Contact Bill Ross